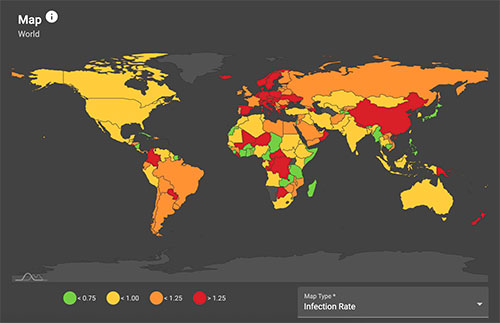
Big data is helping researchers to not only track COVID-19, but also predict with increasing accuracy geographical areas where the disease is spreading and receding.
The Tuesday APHA 2021 session “GIS, Big Data and COVID-19” offered a glimpse under the hood of how researchers are gathering, consolidating and presenting the data. Monitoring the spread and control of COVID-19 offers opportunities for data comparisons that predict infection and mortality trends, a potential boon to public health.
Peter Zimmerman, a professor of population and quantitative health sciences in the School of Medicine at Case Western Reserve University, helped design COVID-19Predict. The online dashboard provides concise sets of data that anticipate trends, including week-in-advance predictions at county, state and national levels. It also offers real-time data.
 During his presentation, Zimmerman showed dashboard pages revealing that infections are trending downward in Maryland, indicated by a pencil-thin green bar, and upward in Montana, indicated by a thick red bar. A bar’s length reflects the magnitude of change over 14 days. Trends and changes on a monthly scale are reflected, as well.
New and improved technology, such as GIS, which stands for geographic information system, is fueling the big data renaissance. GIS can manage, analyze and map a variety of data.
Big data is also being used to extract mental health indicators through social media feeds. Danny Valdez, an assistant professor at the School of Public Health at Indiana University-Bloomington, talked about a research paper he co-authored that applied big data to Twitter and COVIDcast, an online archive of COVID-19 data maintained by Carnegie Mellon University.
Valdez wanted to explore if there was a relationship in 2020 between mood and COVID-19 infection rates. He looked at 20 metropolitan areas particularly hard hit by the disease. Highly diverse cities endured higher infection rates, which he said indicated that people of color were disproportionately infected.
Evidence also suggests some societal events disproportionately harmed mental well-being in diverse cities. When George Floyd was murdered on May 25, 2020, social media showed a jump in despondent posts. Most posts originated from populations in the most diverse U.S. cities.
“The big push is to combine big data with mental, physical harm,” Valdez said. That information then has the potential to inform effective interventions.
Map image from COVID-19 Predict