The U.S. became more diverse over the past decade, the 2020 national census shows, with Hispanic and Asian populations substantially increasing, and a greater number of people self-identifying with more than one race.
Though the white population remains the largest group, its population declined over the last decade for the first time in U.S. history. Whites accounted for about 58% of the population in 2020, a drop from 64% in 2010. The decline was attributed to an aging population and decreased birth rate.
Meanwhile, the Hispanic population rose 23%, now accounting for almost 19% of the U.S. population, and the Asian population rose 36%, accounting for a little over 11%. The number of Black people increased by 6%, accounting for 12% of people in the U.S. The most racially and ethnically diverse states are Hawaii, California and Nevada.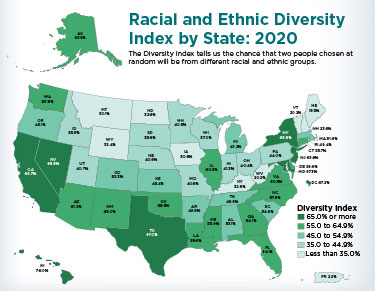
“The U.S. population is much more multiracial and more racially and ethnically diverse than what we measured in the past,” Nicholas Jones, director of race ethnicity research and outreach at the U.S. Census Bureau, said at an Aug. 12 media briefing on the new findings.
The increase in people self-identifying as mulitracial was partly attributed to the census asking more questions, Jones said.
“We are confident that differences in the overall racial distributions are largely due to improvements in the design of the two separate questions for race data collection and processing, as well as some demographic changes over the past 10 years,” he said.
Nearly half of people under age 18 self-identified as Black, Hispanic, Asian or multirace, another sign that America is becoming more diverse.
America’s population is also more urban. Between 2010 and 2020, many rural counties lost residents, while population increased in urban centers. Over 86% of people are now living in urban city environments.
The U.S. housing vacancy rate decreased, with only 9.7% of housing unoccupied in 2020. An eviction moratorium that was put in place during the COVID-19 pandemic in March 2020 helped keep many people in their homes. A shortage of housing in some states and cities, particularly for affordable housing, is driving up prices. Metro areas with the lowest vacancy rates include Modesto, California; Appleton, Wisconsin; and Vallejo, California.
The 2020 census, which was delayed by months due to the pandemic, is used by states to redraw political districts before the 2022 midterm elections. A partial release of 2020 population counts shows seven states losing one House seat each, five states gaining one seat and Texas gaining two seats. The census also informs public policy and funding for infrastructure, education and public health.
“Results from the 2020 Census will be used for the next 10 years to shape the future of our country,” Ron Jarmin, acting director of the Census Bureau, said at the briefing. “Local leaders can use this data to make decisions such as where to build roads and hospitals and how to help our nation recover from the pandemic.”
The 2020 Census Demographic Data Map Viewer allows users to view state-, county-, and census tract-level data from the 2020 census.